This guide describes the methods for debugging miniapps during development.
There are four ways to Preview and Test your MiniApp:
- In Visual Studio Code (docs)
Limitation: does not support certain SDKs (e.g., motion). - In Android Simulator (docs)
Limitation: does not support GoPay JSAPIs (getAuthCode, launchDeeplink, launchUri, and launchPayment) - In IOS Simulator (docs)
Limitation: does not support GoPay JSAPIs (getAuthCode, launchDeeplink, launchUri, and launchPayment) - In GoPay (docs)
No limitation, you need to publish and release miniapp first. This will not appear in GoPay page until it's officially release so you may safely test this.
Note: If you see errors while testing in a browser, it’s because the APIs are only supported within the GoPay app and are not available in browsers.
Visual Studio Code
-
Open VS Code and Render application.
-
Click Preview Miniapp in the plugin sidebar.
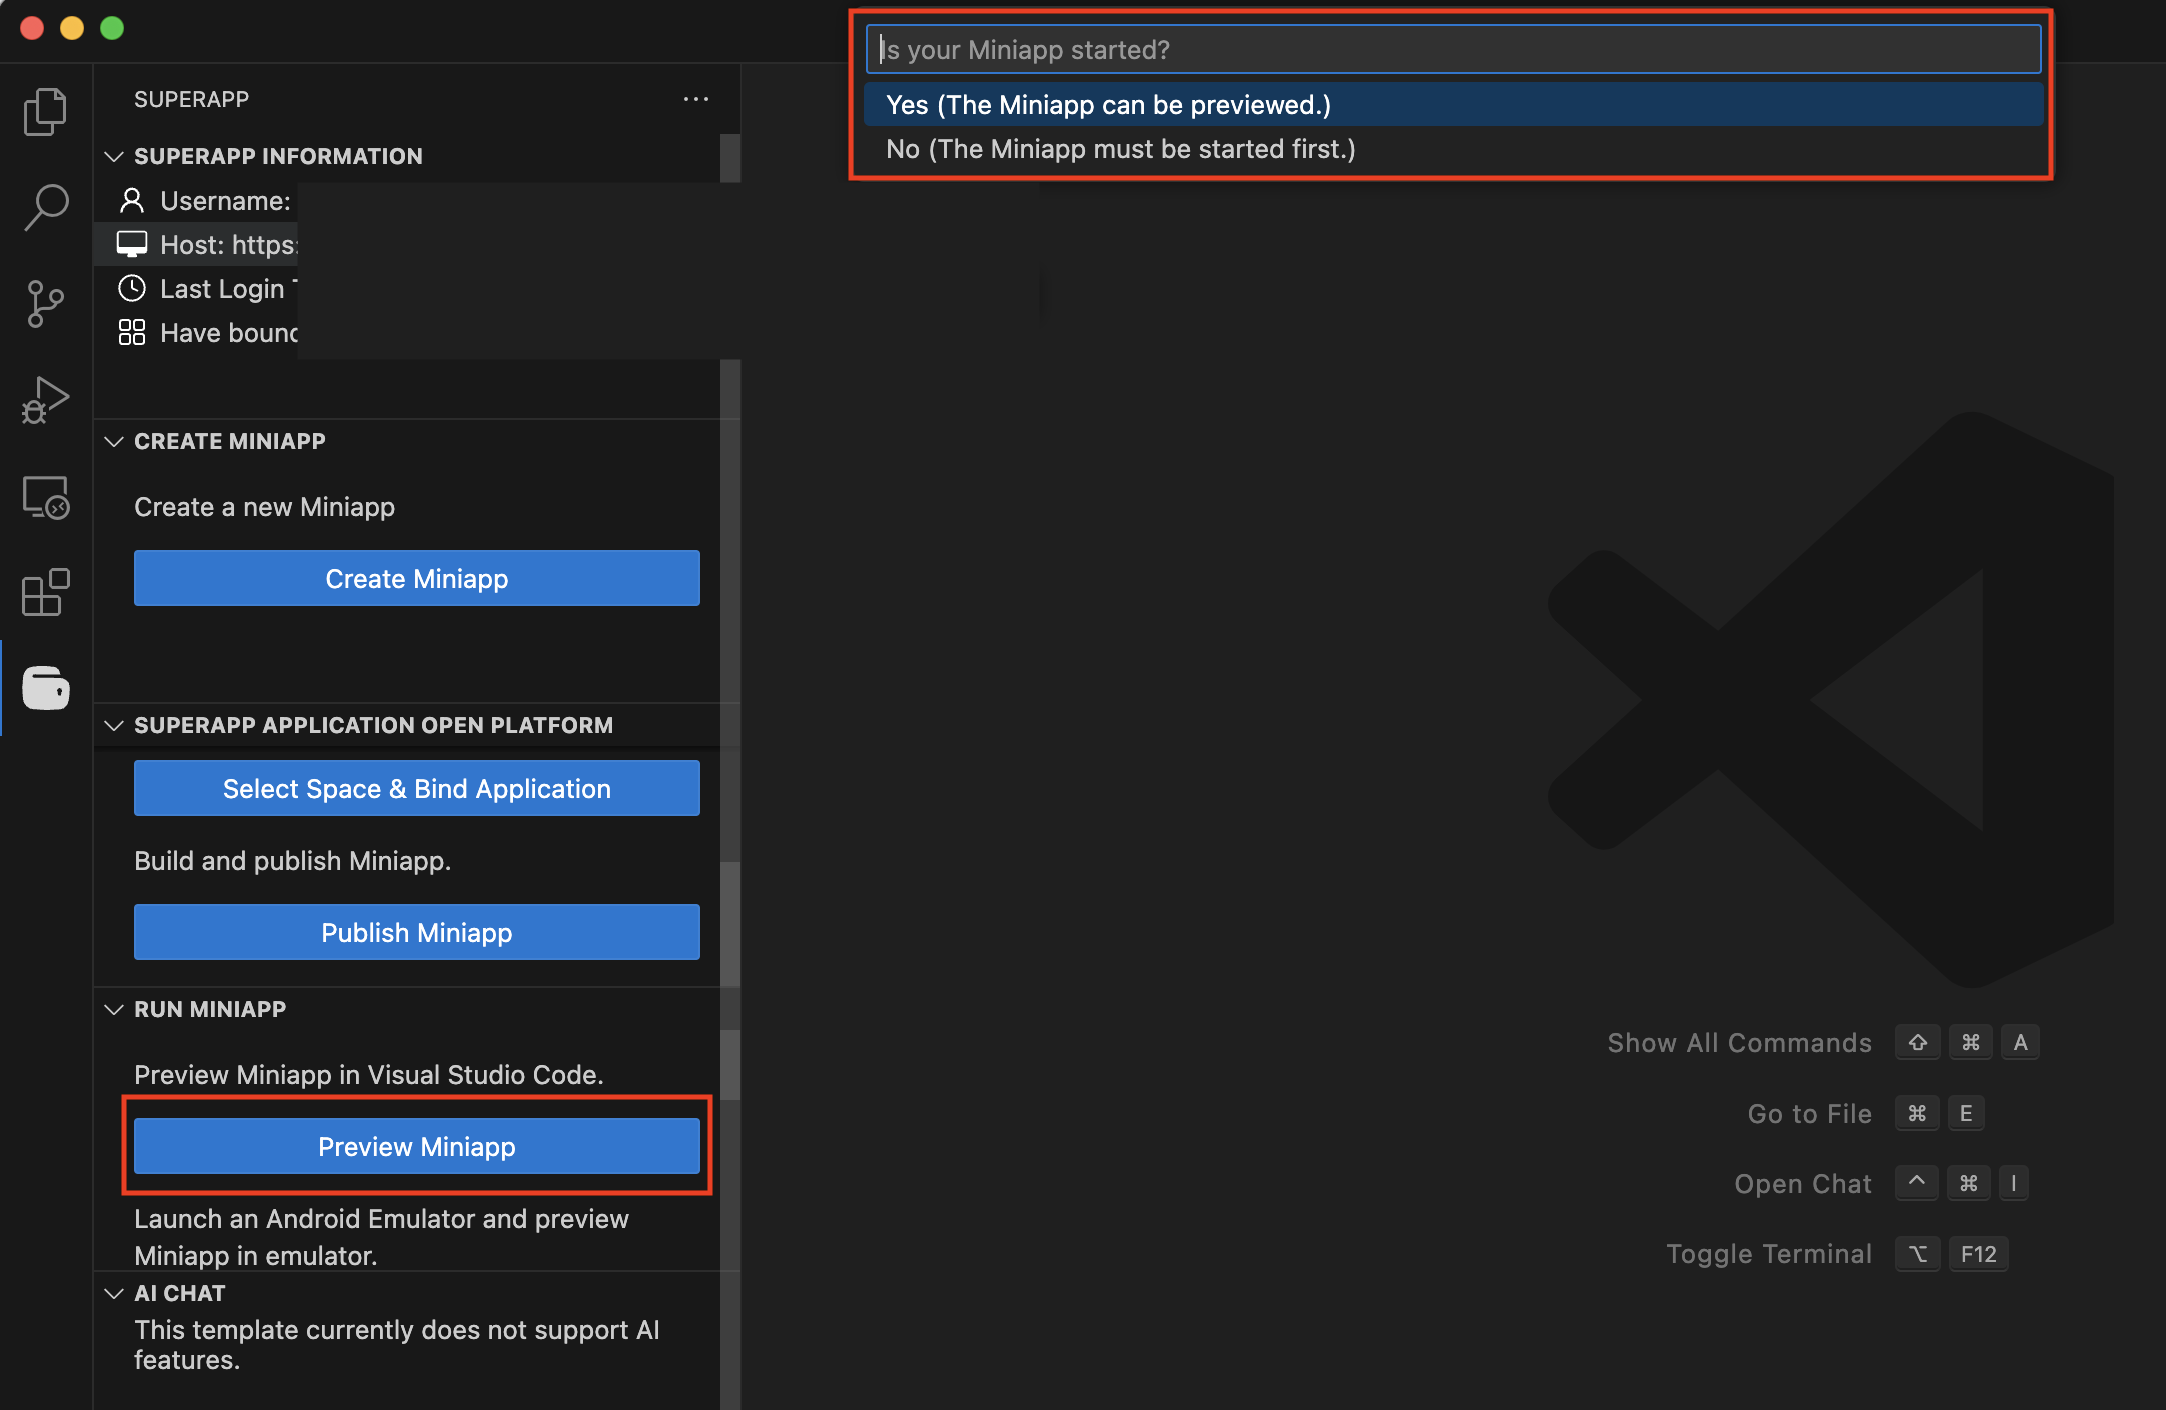
- Yes: Manually input your MiniApp preview URL.
- No: The plugin will run your start script and show the preview input afterward.
-
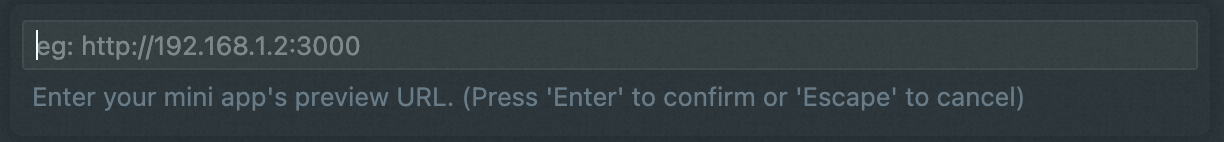
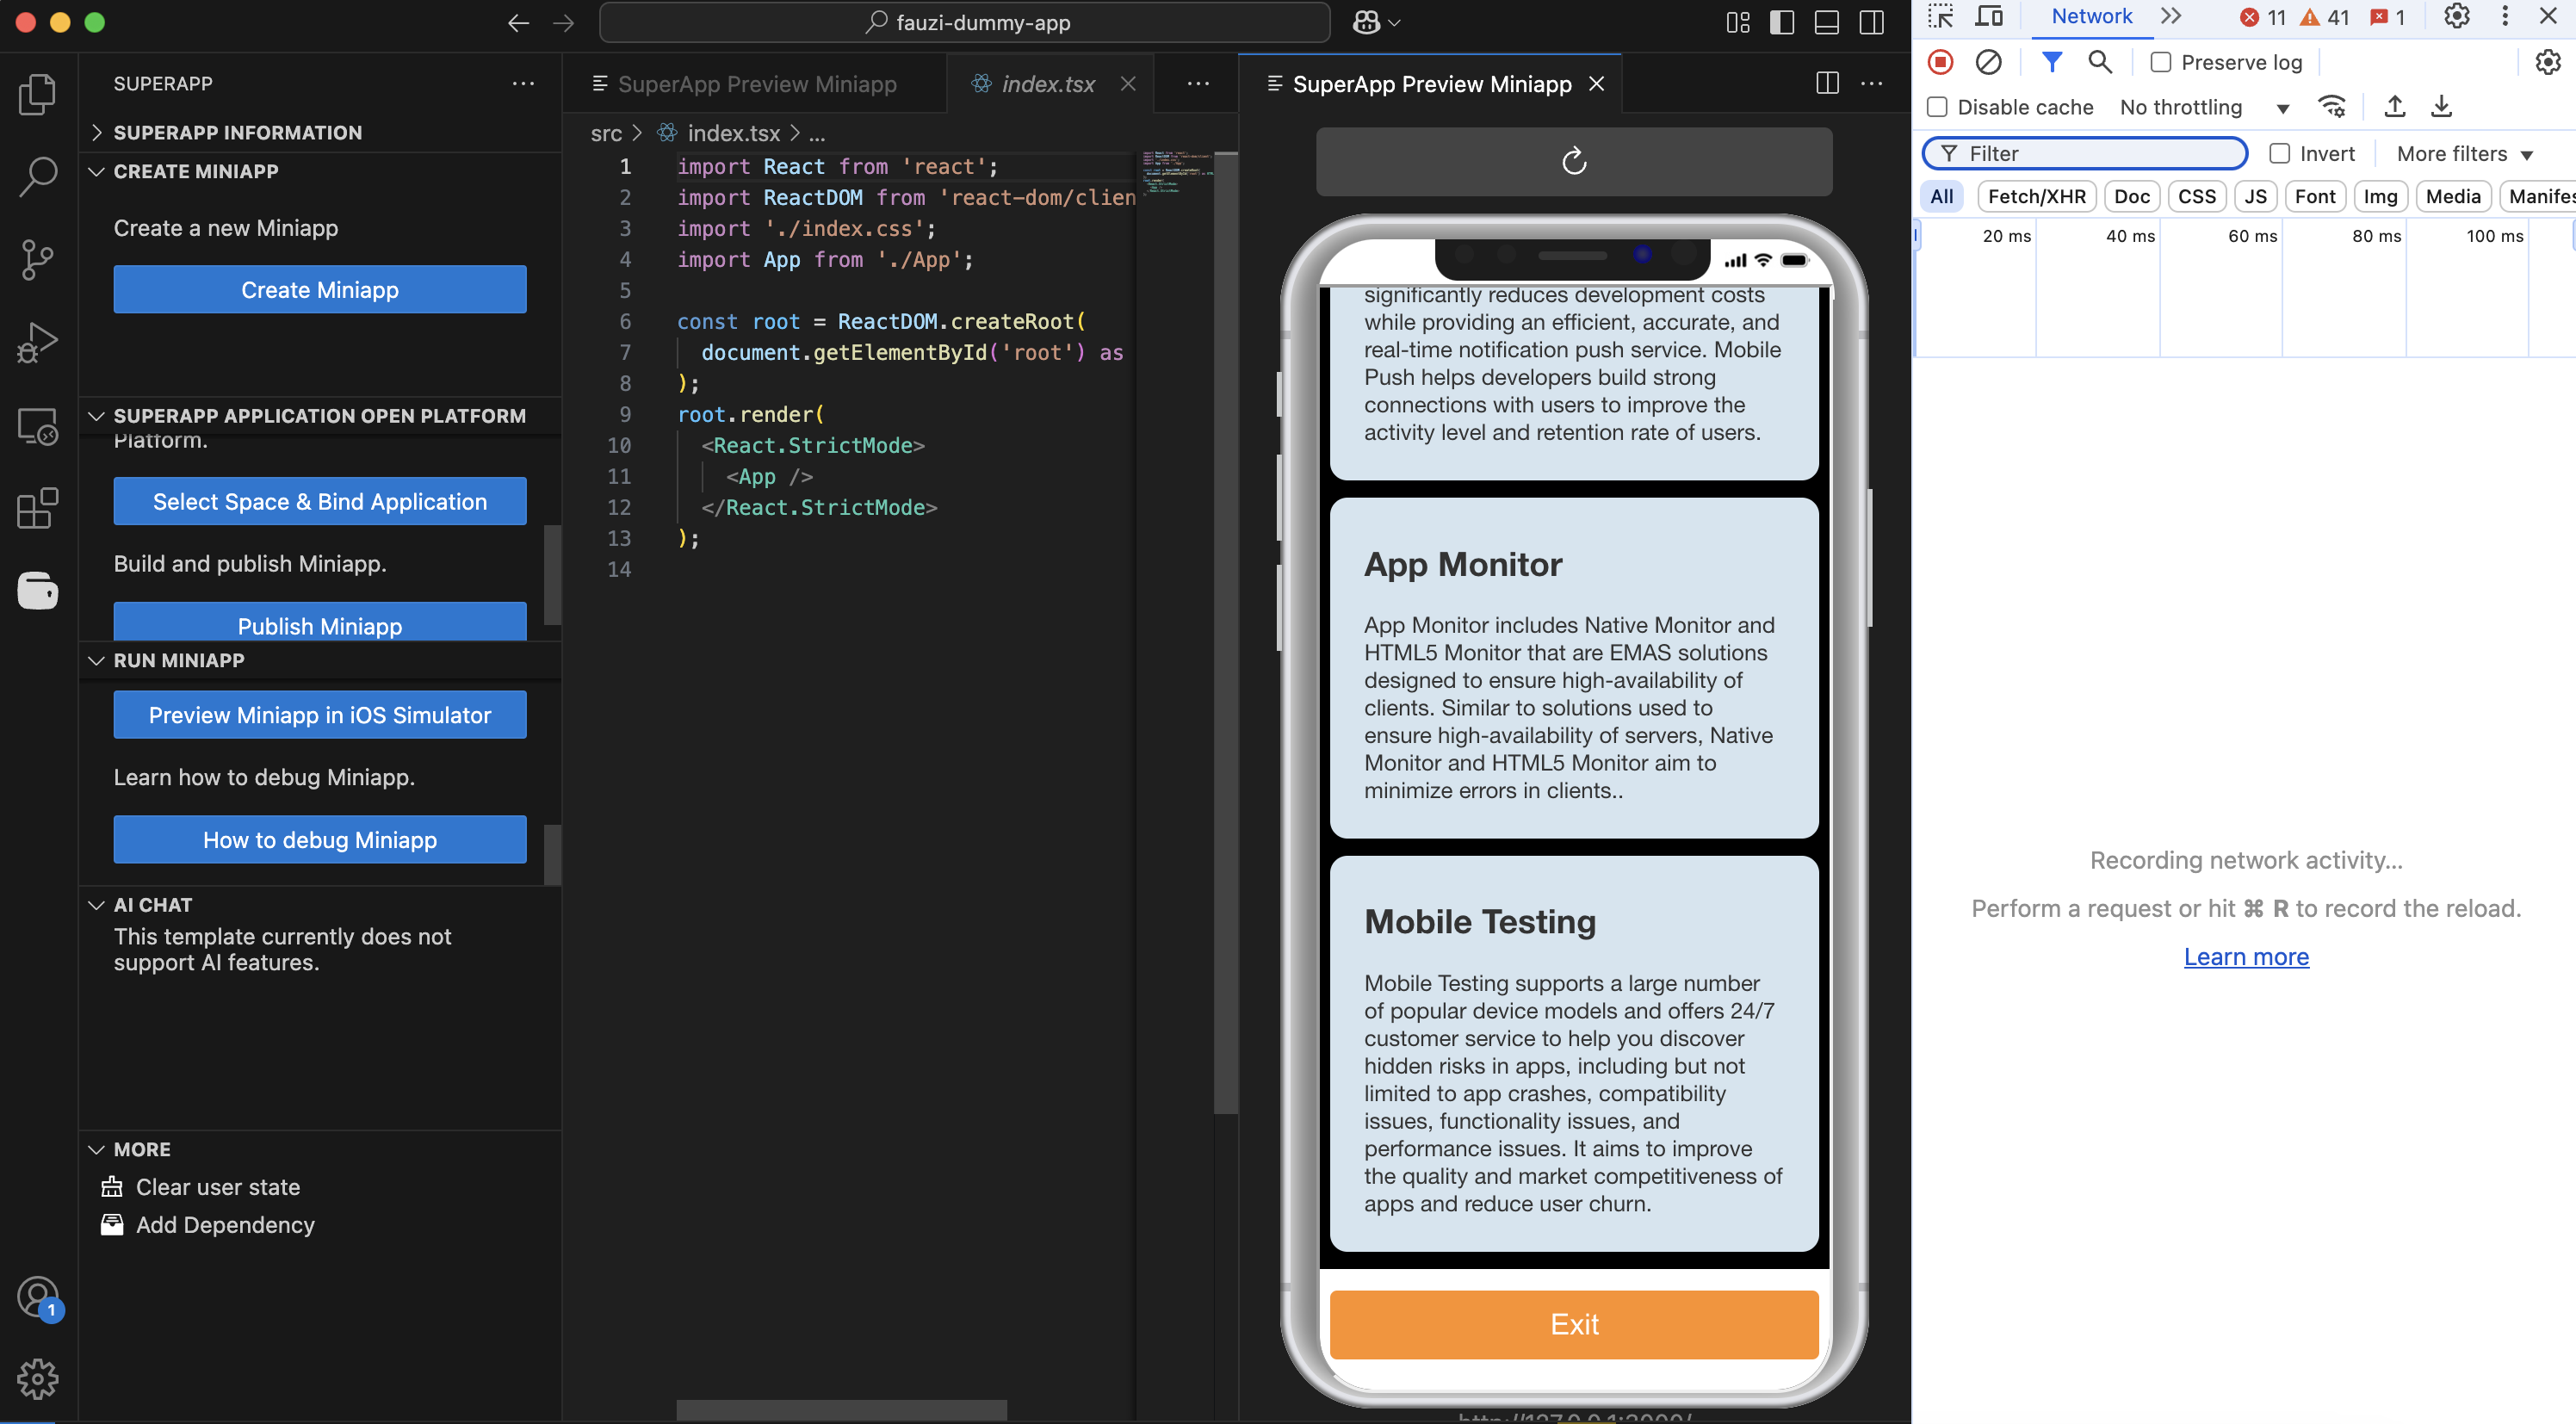
Paste your MiniApp URL in the top input field..
-
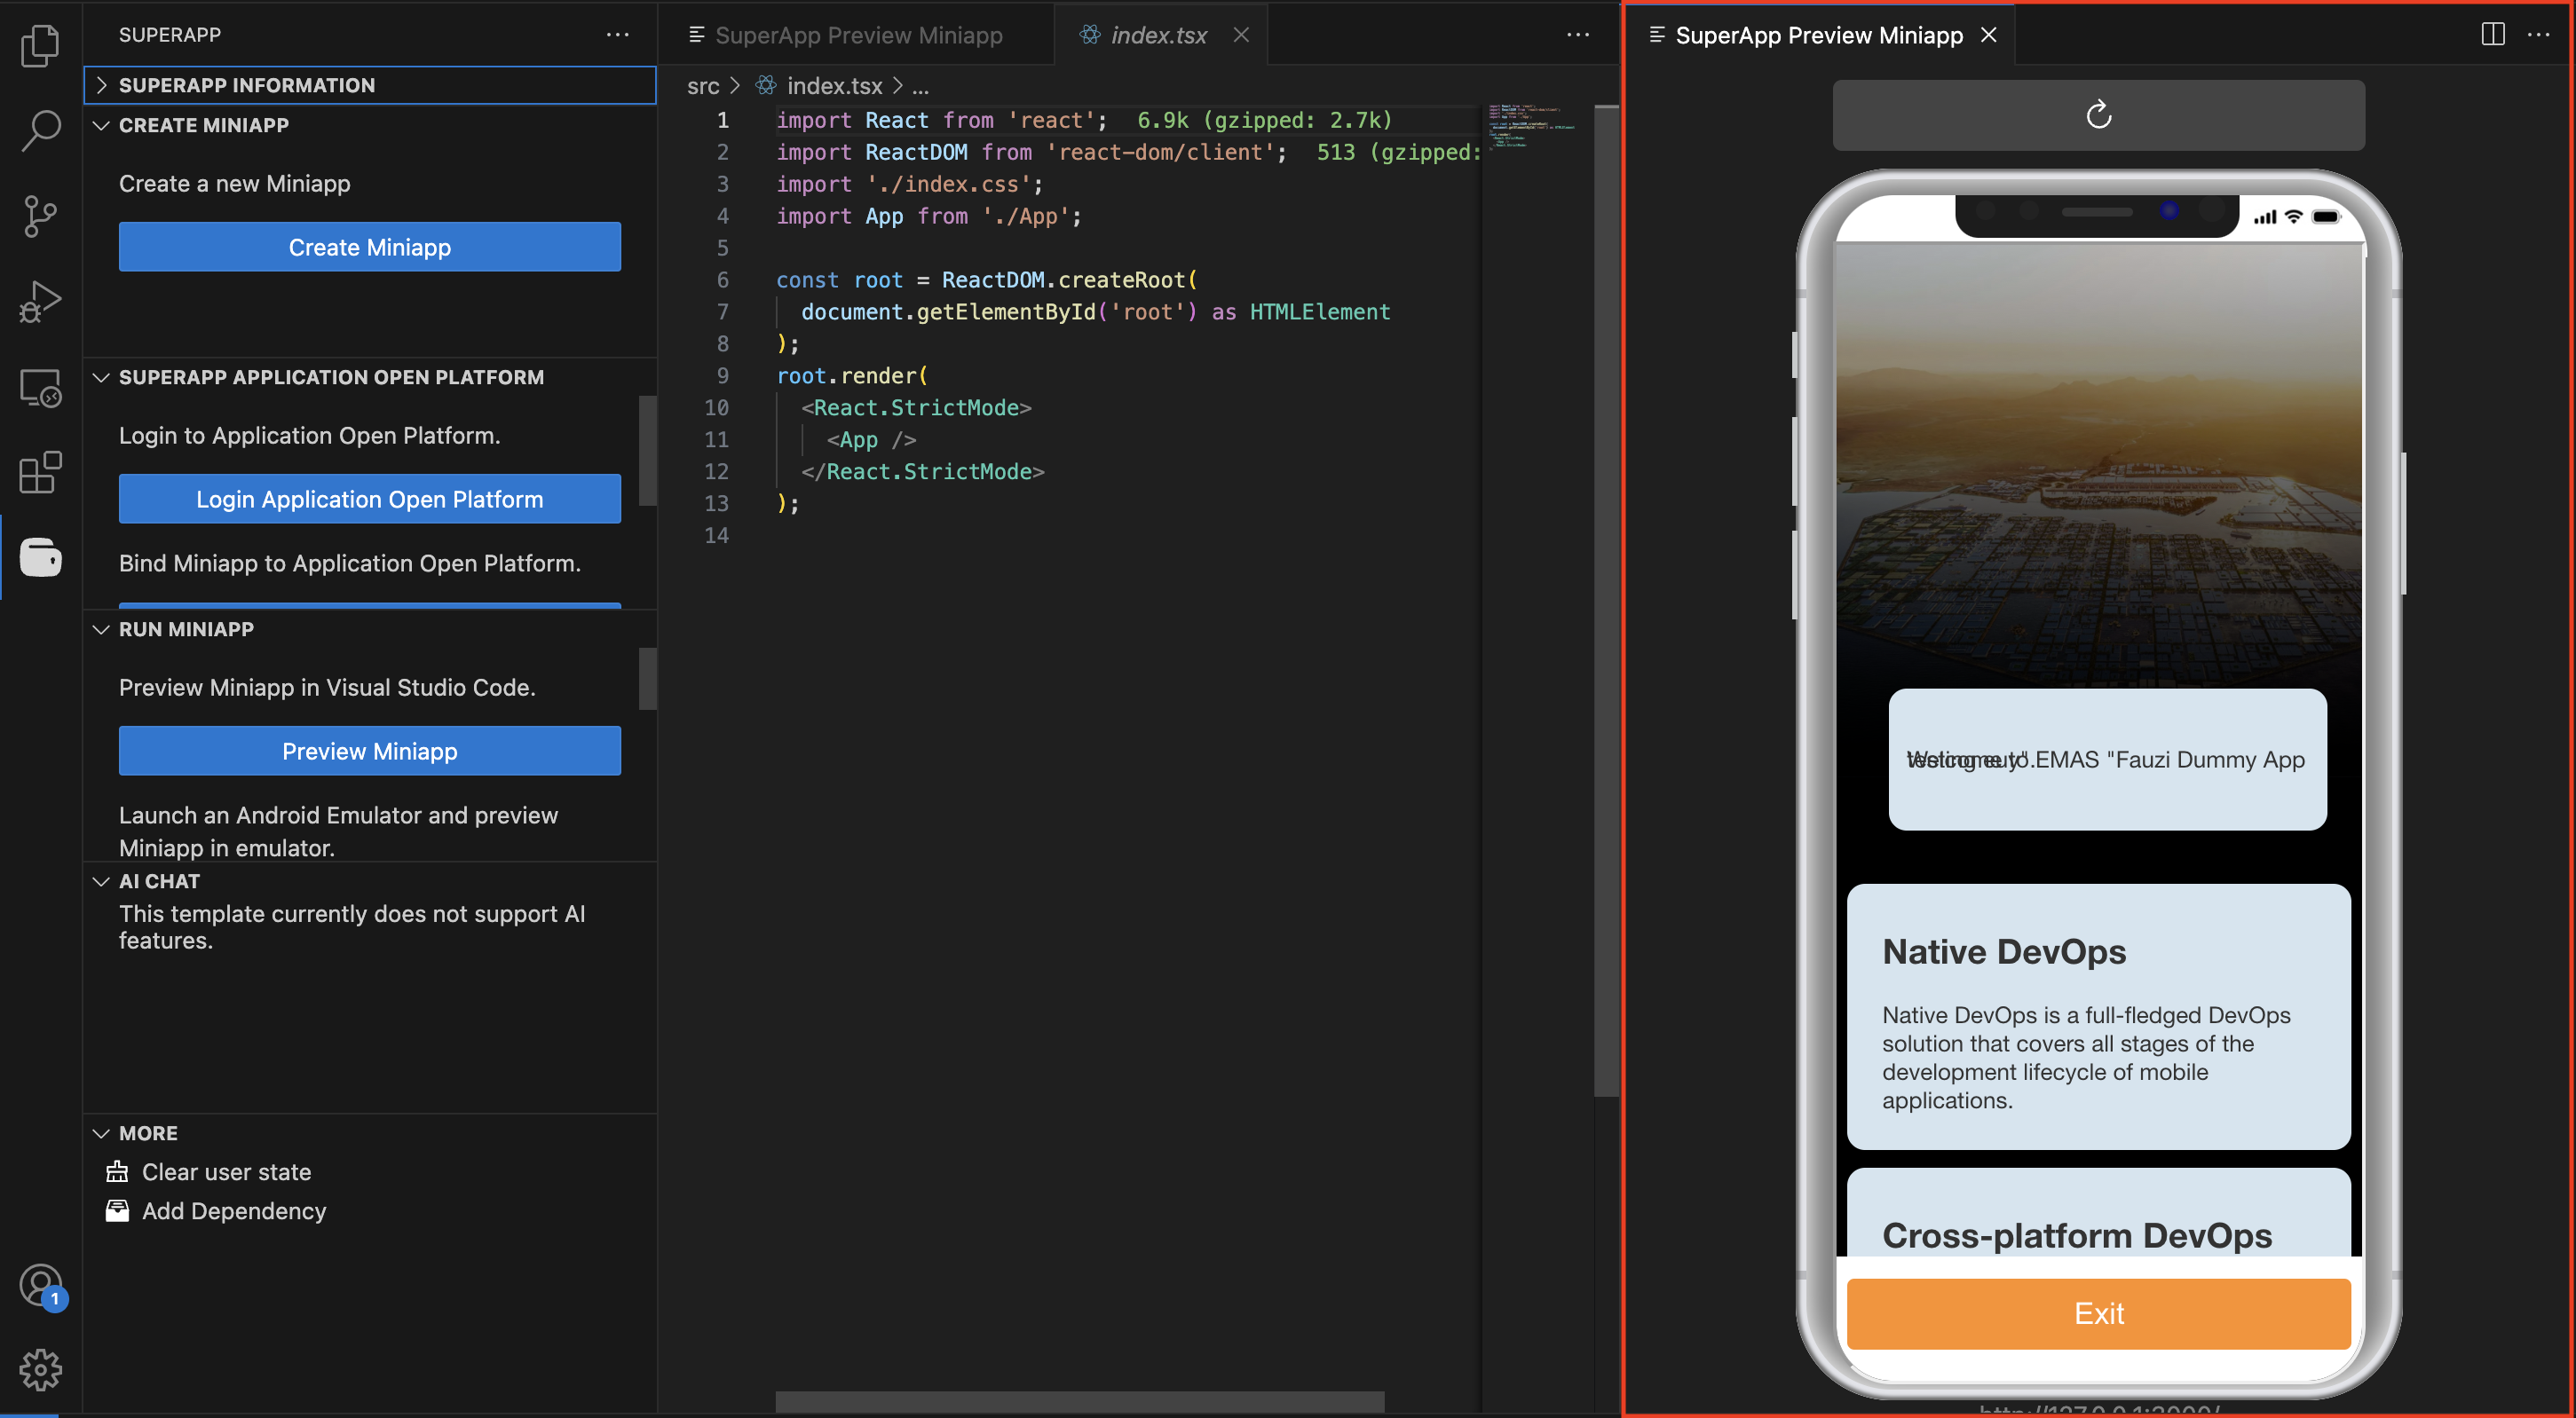
The preview will appear inside VS Code..
-
To debug, run Developer: Toggle Developer Tools from the command palette..
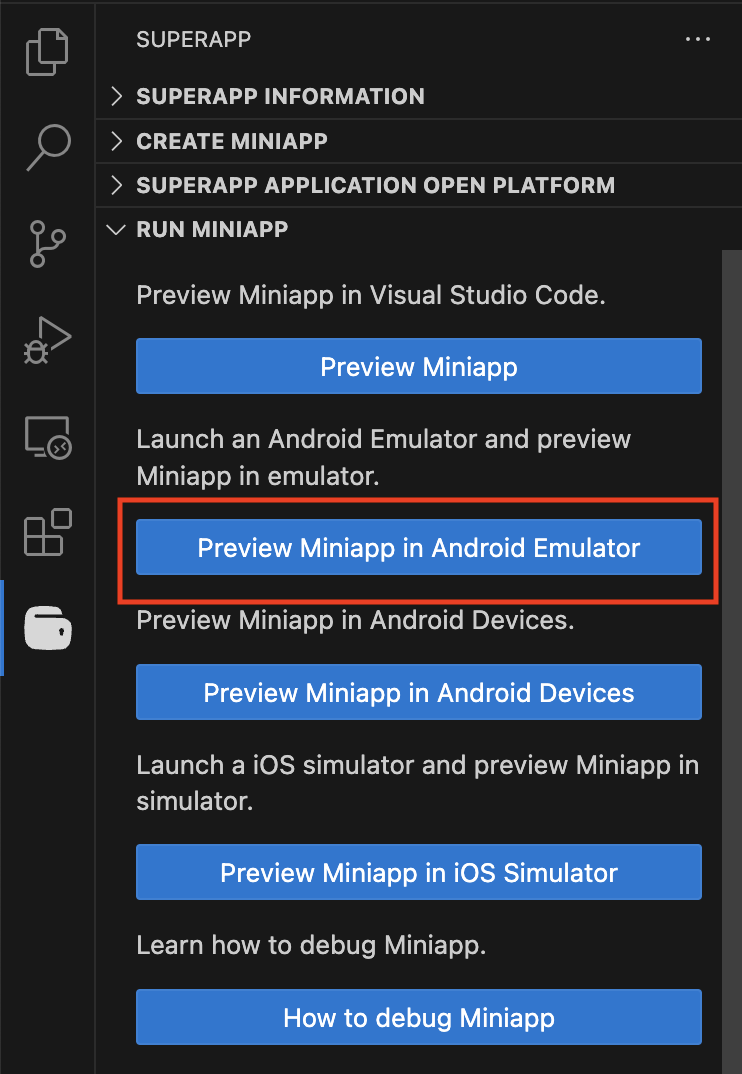
Android Simulator
-
Click Preview Miniapp in Android Emulator..
-
Enter the preview URL in the field that appears..

-
Open Chrome → go to
chrome://inspect/#devices→ find the WebView and click Inspect..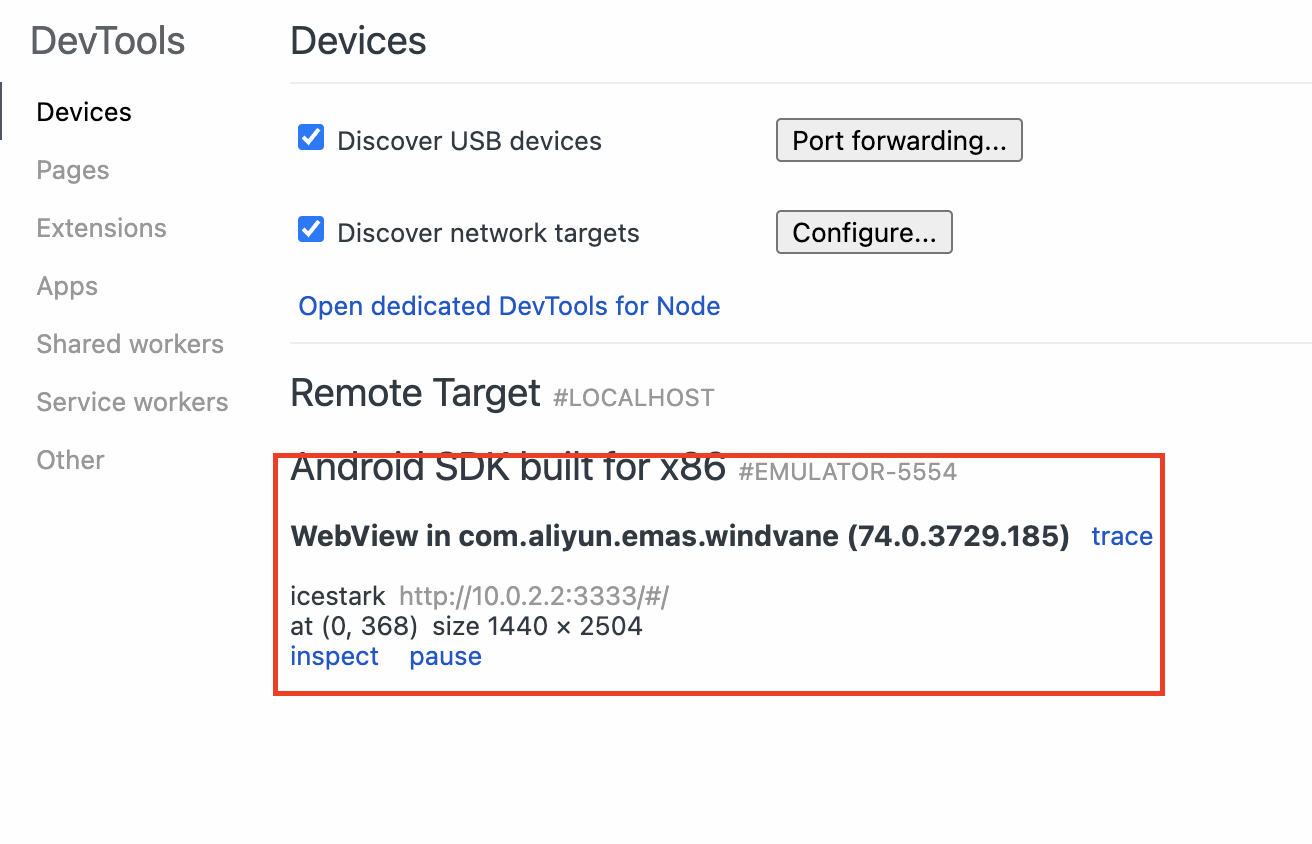
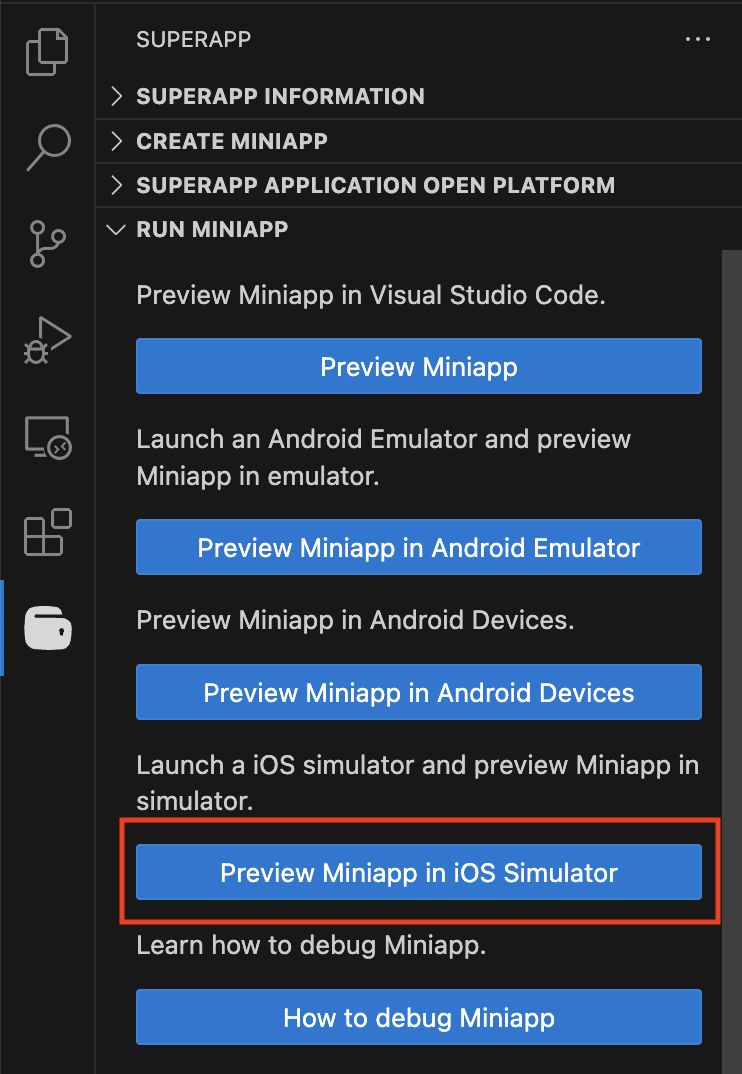
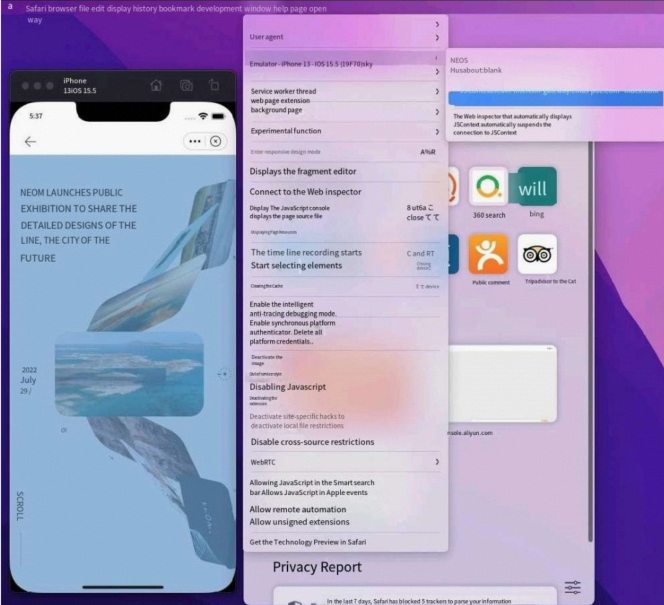
IOS Simulator
-
In Safari: Enable Develop menu in Preferences > Advanced.
-
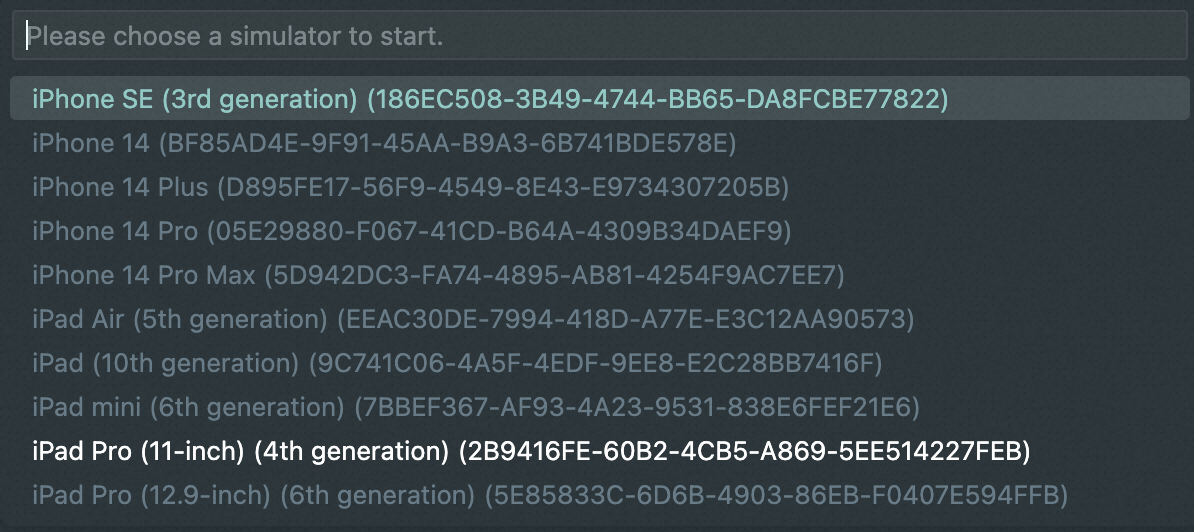
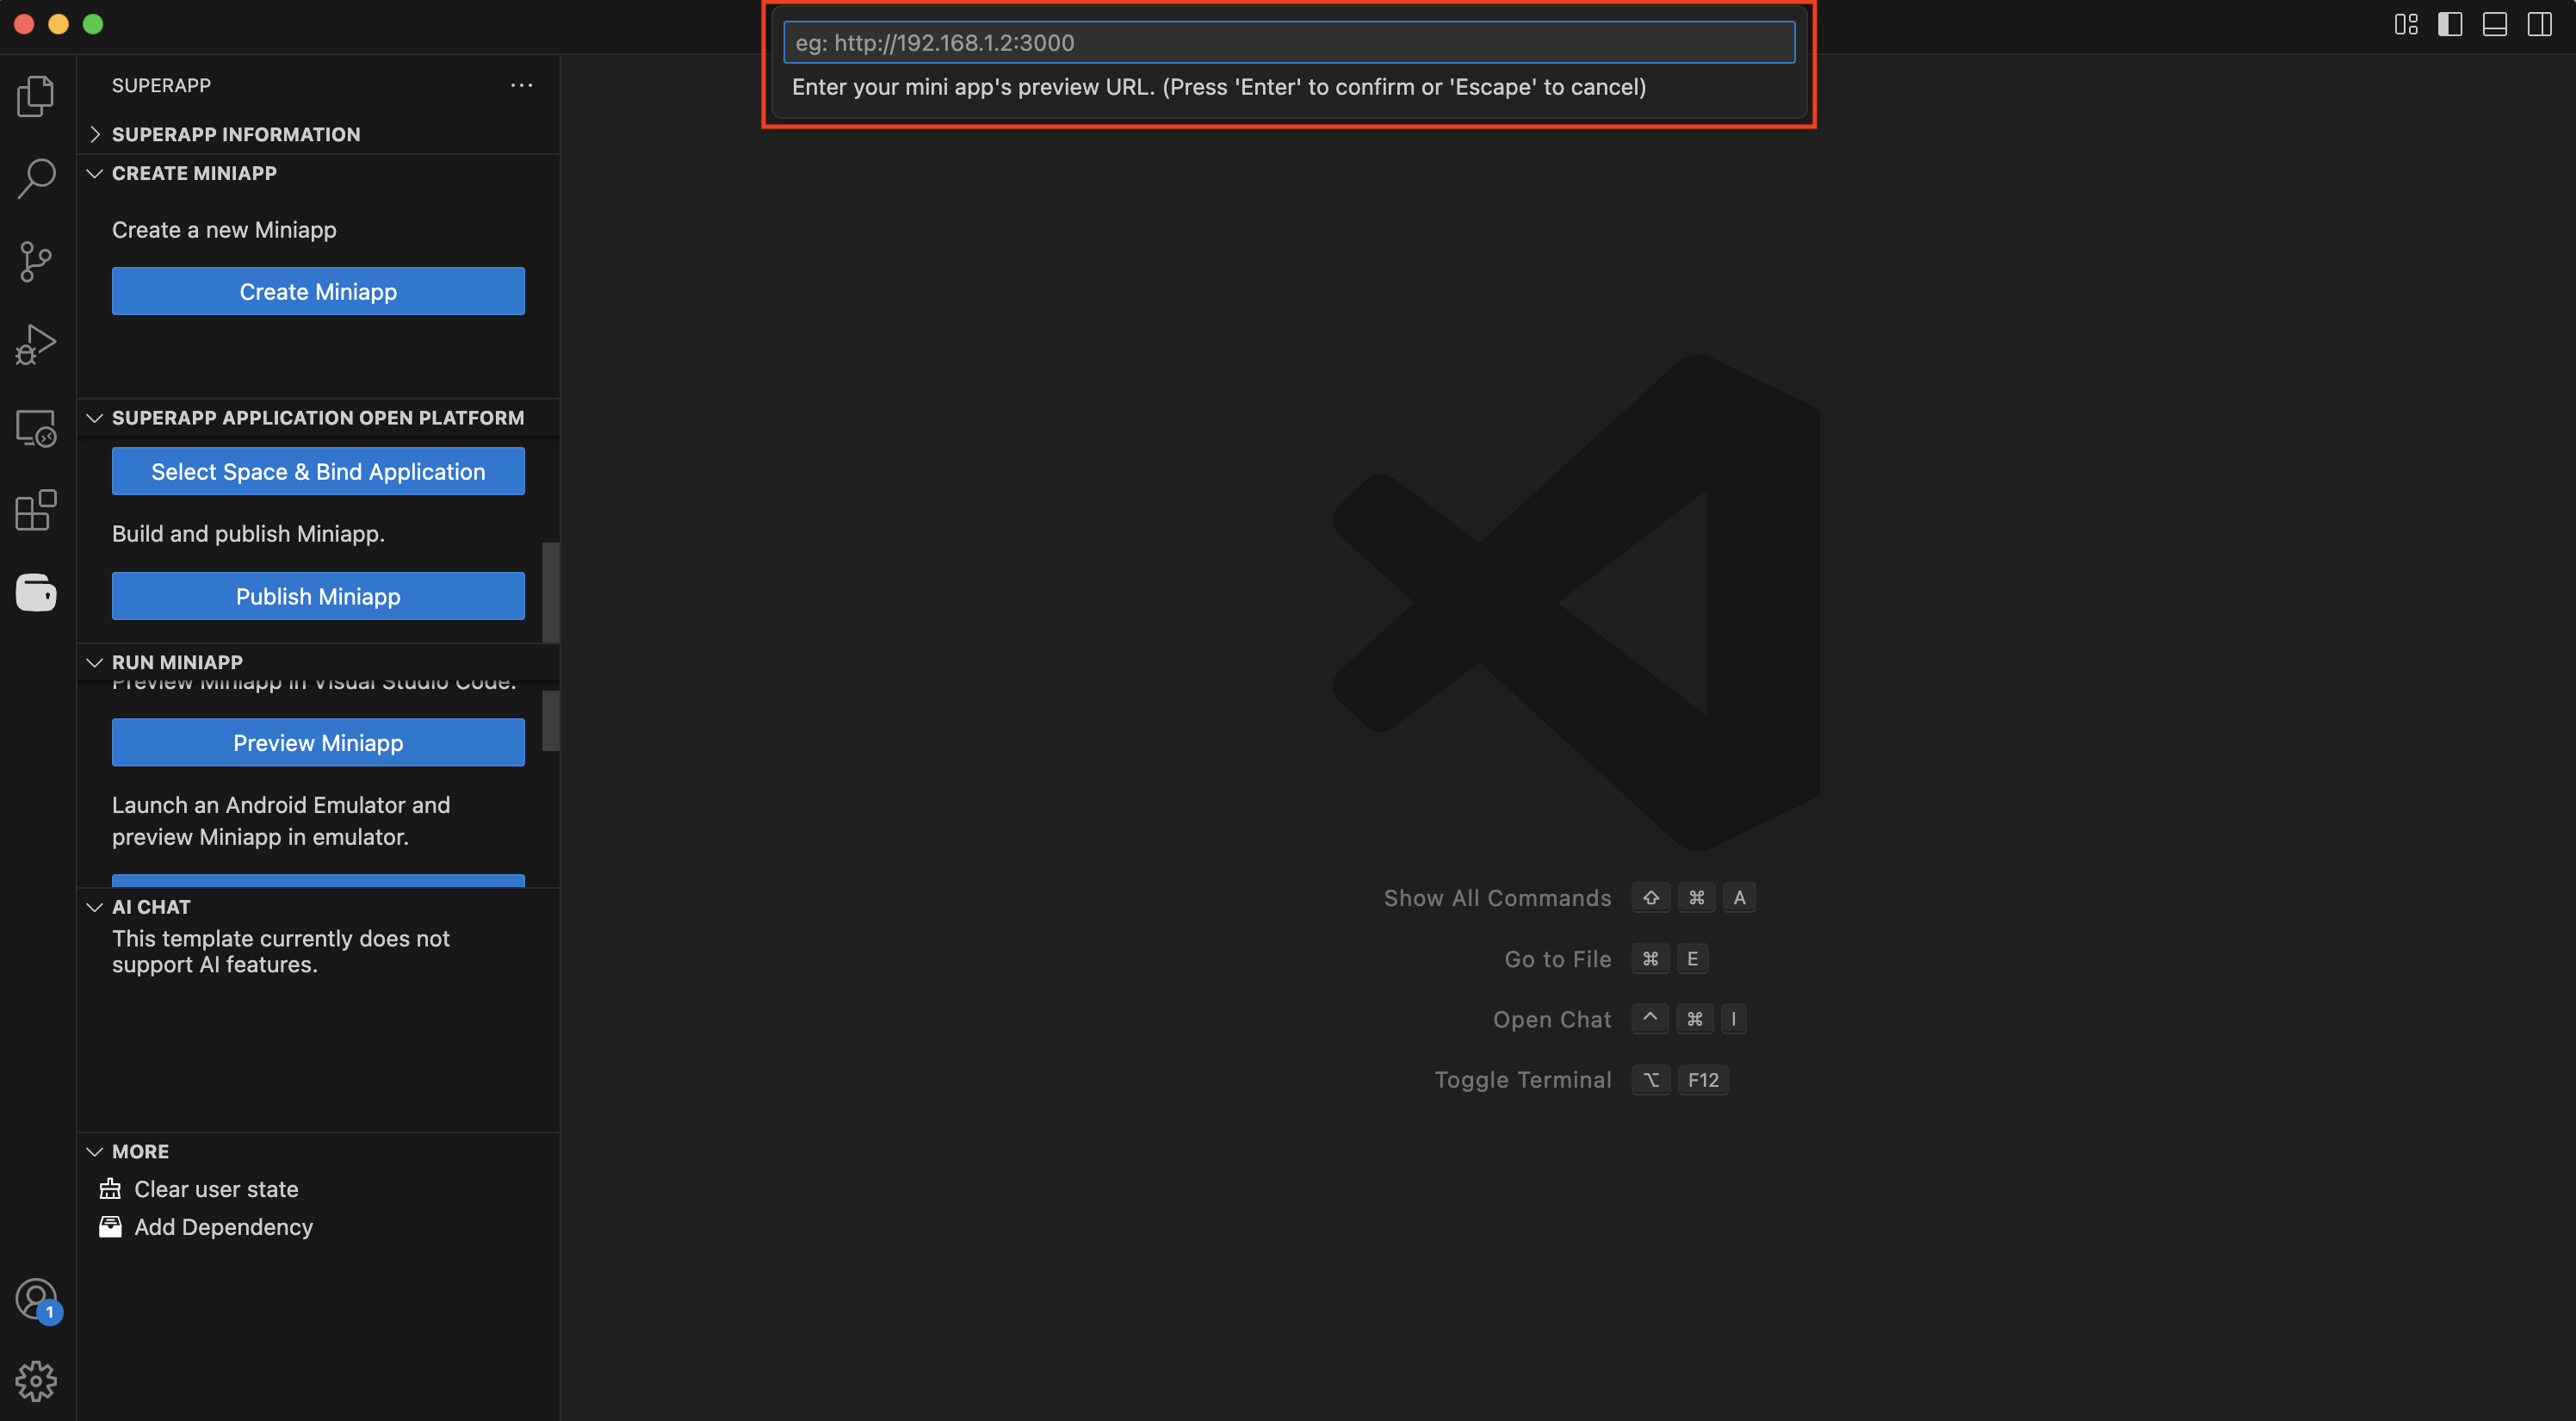
Click Preview Miniapp in iOS Emulator, then select a simulator.
-
Enter the MiniApp preview URL.
-
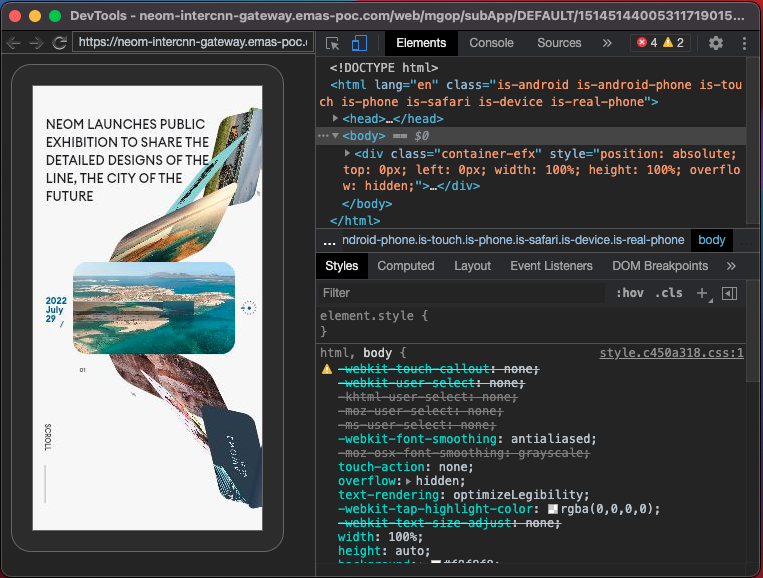
In Safari: Go to Develop > Simulator, then click the WebView to inspect it.
-
Click the WebView object that you want to inspect, and then debug the miniapp in Web Inspector.